(c) 2014-11-25 Teruhisa Okada
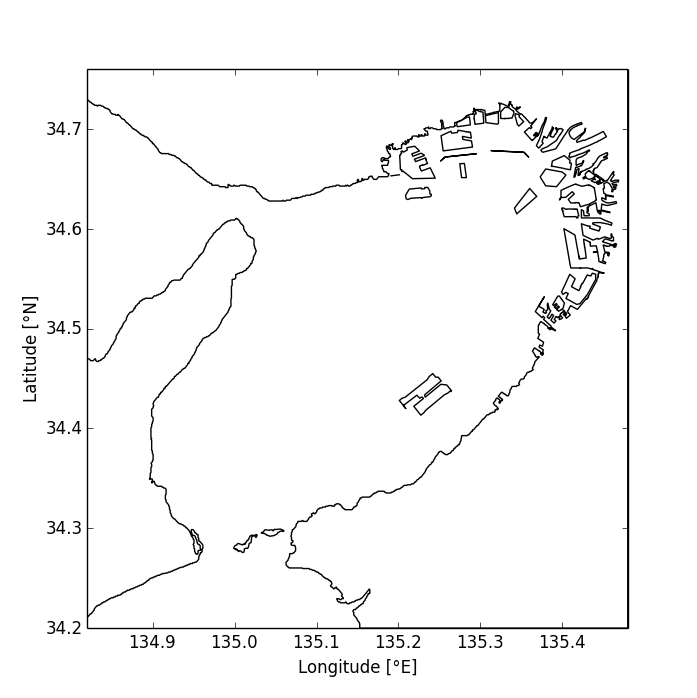
You need coastal line data file (deg_OsakaBayMap_okada.bln).
We will post the file or format later.
|
1 2 3 4 5 6 7 8 9 10 11 12 13 14 15 16 17 18 19 20 21 22 23 24 25 26 27 28 29 30 31 32 33 34 35 36 37 38 39 40 41 42 43 44 45 46 47 48 49 50 51 52 53 54 55 56 |
from matplotlib.patches import Polygon from matplotlib.collections import PatchCollection from matplotlib.ticker import * import matplotlib.pyplot as plt import csv def basemap(data='deg_OsakaBayMap_okada.bln'): """ Title: Function of plotting map in Osaka Bay Created on 2014/07/17 Referrence: http://matplotlib.org/examples/api/patch_collection.html """ # Initialize ax = plt.subplot() patches = [] # Get land data with open(data, 'r') as f: reader = csv.reader(f) for row in reader: row = row[0].split('t') if '' in row: try: lands = Polygon(land, True) patches.append(lands) except: pass land = [] else: land.append(map(float, row)) lands = Polygon(land, True) patches.append(lands) # Plot patches p = PatchCollection(patches)#, alpha=0.5) p.set_facecolor('w') ax.add_collection(p) # Set figure options ax.set_xlabel(u'Longitude [N{DEGREE SIGN}E]') ax.set_ylabel(u'Latitude [N{DEGREE SIGN}N]') ax.xaxis.set_major_formatter(FormatStrFormatter('%.1f')) ax.yaxis.set_major_formatter(FormatStrFormatter('%.1f')) ax.set_xlim([134.82, 135.48]) ax.set_ylim([ 34.20, 34.76]) basemap() plt.show() |